NavList:
A Community Devoted to the Preservation and Practice of Celestial Navigation and Other Methods of Traditional Wayfinding
From: Dave Walden
Date: 2010 Jan 11, 09:30 -0800
Running Fix vs Estimated Position -- Monte Carlo assessment
The question of the relative merits of a traditional running fix vs an estimated postion based on minimizing the distance from the DR position to a point on a second LOP has been discussed recently. Three attachents are given which summarize a Monte Carlo simulation that was carried out in an attempt to provide some quantitative results to further the discussion.
A quote from the renowned naturalist Louis Agassiz: "Go to nature; take the facts into your own hands; look, and see for yourself."
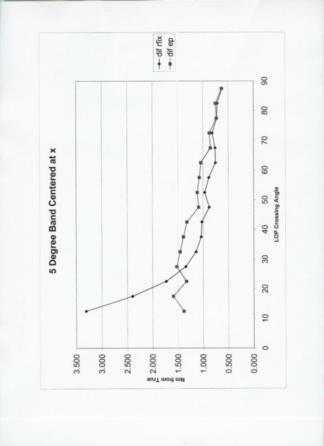
First, a plot of average distance from true postion to Rfix or EP in nautical miles. This shows a number of things. When the crossing angle between the two LOP's is small, the traditional running fix can produce large errors. Not surprinsing. In fact, well known and expected. (And reassuring to find in the result!) When the crossing angle between the two LOP's is small, the EP does well. Not surprising after a little thought. The EP is "anchored" by the DR and doesn't get too far away. At 90 degrees, the two methods give the same result. Again, expected and reassuring to see. Interestingly, for crossing angles between about 25 degrees and 90 degrees, the traditional running fix method gives better results.
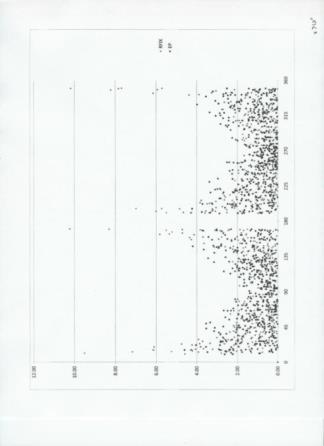
Next, is a scatter plot showing error in nautical miles as a function of crossing angle between LOP's. As expected from the above, when the angle is near 90 (or equivalently, 270), the error is lower. At 0 (or 180) the errors in Rfix are large. (In fact there were Rfix values off scale at very small crossing angles, but the scale was chosen so as to provide a 'reasonable' view over the range of anagles.)
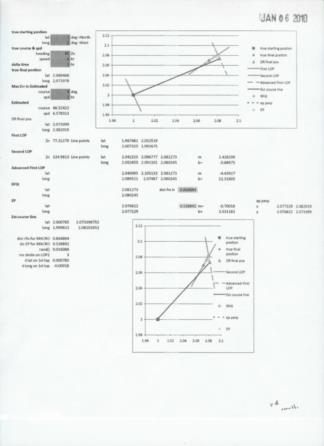
Last, a view of the spread sheet that was used to produce the data above. The Rfix and EP are both plotted. A visual basic macro was written to copy the inputs and results of this sheet to a table on another sheet. The excel rand() function was used to provide variation and 1000 runs were made. The input values for the above results were:
Latitude: 2 degrees North (but not expected to affect the conclusions)
Longitude: 2 degrees East (but not expected to affect the conclusions)
ships course: 45 degrees (but not expected to affect the conclusions)
error in estimated ship course: +/- 5 degrees, uniformly distributed randomly
Ships speed: 6 knots
error in estimated ship speed: +/- 2 knot, uniformly distributed randomly
time interval: 1 hour
Azimuth of LOP 1: 0-360 degrees, uniformly distributed randomly
Azimuth of LOP 2: 0-360 degrees, uniformly distributed randomly (independant of LOP1)
Error in initial DR postion: +/- 3 nautical miles along LOP1, uniformly distributed randomly
----------------------------------------------------------------
NavList message boards and member settings: www.fer3.com/NavList
Members may optionally receive posts by email.
To cancel email delivery, send a message to NoMail[at]fer3.com
----------------------------------------------------------------


