NavList:
A Community Devoted to the Preservation and Practice of Celestial Navigation and Other Methods of Traditional Wayfinding
Re: Rejecting outliers
From: Peter Hakel
Date: 2011 Jan 1, 11:37 -0800
From: Peter Hakel
Date: 2011 Jan 1, 11:37 -0800
From: Fred Hebard
All of this discussion could be informed immensely by some data and associated analyses. Data talk.
=============================================================================
In the attached files I modified my earlier example as follows:
file source_data.png:
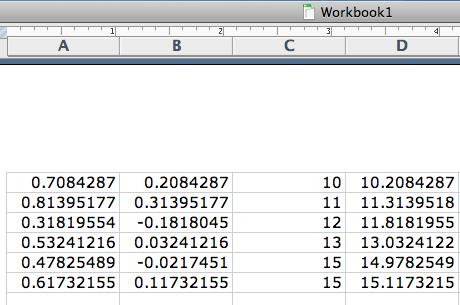
The six altitudes (column C, with #5 off from the linear trend by only 1 degree this time) are changed by a random number between -0.5 and 0.5 (column B). Column D (=C+B) is entered as input into column B in average1.xls.
file average1.xls:
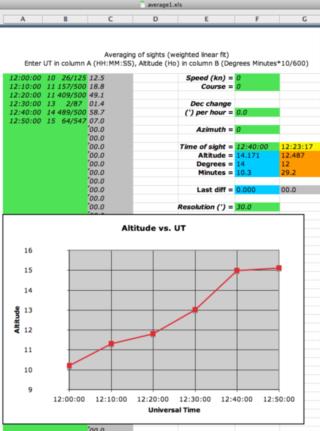
"Resolution" in F16 was changed to 0.5 degrees to roughly coincide with the spread of the random scatter in the data.
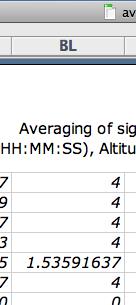
The averaged value at UT=12:40:00 (when the "bad" altitude of 14.978 happened) is calculated to be 14.171, which is better than H0=14.318 (file altitudes.png, cells J24, J25 in average1.xls) produced by the initial non-weighted least squares fit. In file weights.png we can see that the "bad" data point is not completely removed from consideration but its influence on the final fit is reduced by the factor of 1.536 / 4 relative to the other five "good" data points. The number "4" you see in column BL is 1 / "Resolution"-squared.
The difference | H0-H_fit | = 14.318 - 14.171 = 0.147 could serve as a ballpark indicator of how much uncertainty is associated with this result.
Thus, an outlier is identified and not allowed to completely skew the final result (Peter Fogg's concern). However, unless it is really crazy like my earlier 66, it is not completely removed from the data set, either (Geoffrey Kolbe's concern). The calculated weights express how important each data point is considered by this procedure to be (George Huxtable's concern). I propose the | H0-H_fit | quantity as a guide to what extent the final result can be trusted, which is every navigator's concern. Sure, this does require a computer which may not work when needed, that is always a possibility; but that is true for all machines to some extent, including chronometers and sextants.
Happy New Year to all! :-)
Peter Hakel
File: 115099.average1.xls


