NavList:
A Community Devoted to the Preservation and Practice of Celestial Navigation and Other Methods of Traditional Wayfinding
Re: Rejecting outliers: was: Kurtosis.
From: George Huxtable
Date: 2011 Jan 2, 17:04 -0000
From: George Huxtable
Date: 2011 Jan 2, 17:04 -0000
Fred Hebard wrote-
"All of this discussion could be informed immensely by some data and
associated analyses.  Data talk."

And in a later posting, objected to the use of simulated data, rather than
real data.

In my view, both have their place. With simulated data, it's possible to
know the exact value of the original quantity, before it's subjected to
deliberate perturbations, so you can discover how well an analysis
procedure recovers that original quantity from the perturbed data.

But in general, I agree with Fred. I can't think of any more appropriate
set of data to investigate than that set of 9 observations which has been
proffered by Peter Fogg on many occasions over the last 3 years, most
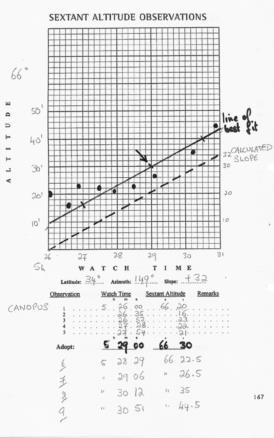
recently on 13 Dec 2010, attached as "102278.example slope.jpg" under
threadname "[NavList] A 'real-life' example of slope", and attached here
under the same label. That plots and also tabulates the 9 observations,
together with values for latitude and azimuth, which if correct result in a
calculated slope of 32 arc-minutes in the 5 minite period of observation.

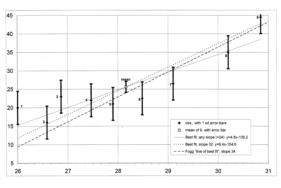
I have replotted those points as an Excel chart, attached as "slope fit
3.xls", and for those who don't have Excel, as a simple picture, "slope fit
3.gif", which shows exactly the same thing. 5 hours should be added to the
time in minutes on the bottom scale to correspond to time of day, and 66º
to the altitudes shown in arc-minutes.

What I have done is to plot all 9 points of that series, discarding none.
Error-bars have been estimated, based on the observed scatter, of +/- 4.45
arc minutes. They have then been analysed in a number of different ways.

First, they have been treated as most navigators would do, by simple
averaging. This boils them down to a single mean point we will call P, at
which the averaged time is 5h 28m 10s, and the averaged altitude is 66º
25.9'. The standard deviation of that mean is reduced, compared with that
of each individual observation, by a factor of 3 (= root 9) to +/- 1.48
arc-minutes, as shown by its error-bar. This single point is then chosen to
represent the altitude in subsequent calculations.

Second, a line, constrained to have a slope of 32' in 5 min of time, has
been fitted to those points as well as possible, minimising the squared
deviations from it, and plotted as a dotted line. That slope was chosen  to
accord with Peter Fogg's own estimate. It's on the basis of those
deviations from that line, that the standard deviation of the data-points
has been assessed. Whatever its slope, every such line has to pass through
the point P, as Lars Bergman pointed out in a posting on 9th December. It
will be clear to most navigators that the observed points appear perfectly
compatible with that line, in the way they scatter around it. The largest
departure is that of point 1, which differs by 1.85 standard deviations.
Just according to regular Gaussian statistics, we would expect
one-fifteenth of the points (on average) to differ by that much or more, so
it should cause no great surprise to find one such, in a sample of 9. It
provides no grounds whatever for rejecting that point as any sort of
deviant outlier.

Third, we have to consider how Peter Fogg has analysed this observation,
which presents some problems. He has discarded not just observation 1, but
also no. 3. His grounds for doing so have nowhere been stated clearly,
despite numerous requests. Statements about his procedures have used the
word "intuition", more than once. Through the remaining 7 points he has
attempted to fit a straight line, as shown here by dashes. Unfortunately,
though he has specified that line to have a slope of 32' over 5 minutes of
time, his own plot (and therefore mine as well) has actually been drawn
with a slope of 34. (This is the second example in which he has drawn an
erroneous calculated slope.) Whether that error has contributed to his
rejection of points 1 and 3, only he can tell us. After all this, his
slope-fit passes about 1.4' away from point P. Which result is most
true-to-life is impossible to say.

Fourthly, we can ask for a best-fit straight-line to the data, allowing the
best-slope to be freely chosen instead of being constrained to 32. Just a
glance at the data is enough to indicate that the chosen slope of 32' per 5
min does not accord particularly well with the observed data, and a reduced
slope would fit it better. When we do so, the resulting continuous line,
showing a significantly better fit to the 9 observations, has a slope of
only 24. That's by no means conclusive; no more than suggestive, that the
calculated slope of 32 may be somewhat suspect. It would be worth checking
it out once again, to be sure. The quoted latitude of 34º corresponds with
the (South) lat. of his home port of Sydney, so is unlikely to be wrong,
but what about the calculated azimuth of 149º? We haven't been given
sufficient information to check that for ourselves; perhaps we can be
provided with the missing details.

================

I hope this has provided Fred, and maybe others, with enough data to be
able to assess whether Peter Fogg's data-rejection is justified, whether
his procedure (whatever it may be) offers any improvement over standard
statistics, and whether all the prolonged resulting hoo-hah has been
worthwhile.

George.

contact George Huxtable, at george{at}hux.me.uk
or at +44 1865 820222 (from UK, 01865 820222)
or at 1 Sandy Lane, Southmoor, Abingdon, Oxon OX13 5HX, UK.
----- Original Message -----
From: "Peter Fogg"
To:
Sent: Monday, December 13, 2010 7:49 AM
Subject: [NavList] A 'real-life' example of slope


| The attached file, an example of slope in action, comes from a post I
made
| on 10 March 2007 [NavList 2278].  It may seem like a poor round of sights
| compared with Antoine's, but remember the crucial difference often
ignored
| by our armchair navigators: the relative stability of the platform used.
| Unless the sea conditions are abnormally calm, the near-perfection of
| Antoine's sights is in practice unachievable from the deck of a smallish
| sailing boat, in my experience.
|
| The analysis below comes from [NavList 2455] of 22 March 2007:
|
| Sights 1 and 3 have been discarded, as they cannot be matched to the
| slope. This slope, a fact, is then best matched to the pattern of the
| other sights that exhibit random error.
|
| What is the alternative to this technique? In this example, taking
| just the one sight could have been equivalent to choosing any one of
| these sights at random. What were the odds of obtaining as good an
| observation as the slope will produce with just the one sight?
|
| Of a poor sight (#1&3):                      2 out of 9;         22%
| Of a mediocre sight (#2,4,6,7,8,9):          6 out of 9;         67%
| Of poor or mediocre:                         8 out of 9;         89%
| Of an excellent sight (#5):                  1 out of 9;         11%
|
| So at the cost of a little extra calculation and the drawing up of a
| simple graph this 11% chance has been converted to a 100% chance of a
| similar result to what appears to be the best sight of the bunch,
| together with all the other advantages of KNOWING a lot more about
| this round of sights, and being able to derive extra information (eg;
| standard deviation) at will.
|
| Is this a typical example? No. Typically there are fewer sights in the
| 5 minutes, and NONE of the individual sights is as good as the derived
| slope; confirmed by comparing the resulting position lines to a known
| position.
|
File: 115114.slope-fit-3.xls


