NavList:
A Community Devoted to the Preservation and Practice of Celestial Navigation and Other Methods of Traditional Wayfinding
From: Ed Popko
Date: 2015 Jul 2, 11:22 -0700
From time to time, NavList members attach plot sheets to complement posts on topics such as sight reduction or lines of positions. And for sure, members make them up for use on voyages or to record back-yard shooting sessions as well.
Perhaps this small PostScript plot sheet generator will be of interest.
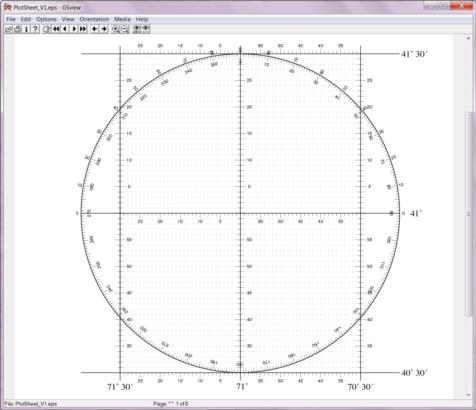
Attached is PlotSheet_V1.zip which contains a small PostScript program that generates very nice plot sheets centered on any whole latitude/longitude you desire. The image shows a typical plot sheet produced by the program. Its latitude/longitude mid-chart point is Frank Reed's home island in Connecticut and it may even include the nitrogen cooled super computer in his basement that serves out NavList threads.
This PostScript program is quite small and totally self contained. There are a variety of ways to use it. You can open it with Adobe Acrobat which will automatically execute it and produce a chart. Other programs, particularly graphics editors accept Encapsolated Post Script (*.eps) as well. You can also include this program within other PostScript scripts though you will have to modify the header lines.
Personally, I invoke this program with a free viewing and printing utility called GSview (https://pages.cs.wisc.edu/~ghost/gsview/get50.htm). GSvew also requires Ghostscript, to generate very high quality and fine detail raster output for printers. GSview functions provides panning/zooming, conversion to high resolution *.gif formats, and different paper sizes etc. See the GSview landing page above for a description of its functions and co-requisite Ghostscript. The attached sample plot sheet is a GSview screen image.
You can set thee options by editing the source code with a standard text editor:
Line 25 "/ctrlat {41} bind def" specifies centering latitude. Key in an integer value, + for north, - south.
Line 26 "/ctrlng {71} bind def" specifies centering longitude, Integer value, + for west, - for east.
Line 393 "0 2 119 {div60 ...." creates the dot pattern for each minute of latitude and longitude. If you do not want them, comment out the line by inserting an "%" at the beginning of the line. You can uncomment the line later if you want to reinstate them in your plots.
Jim Morrison, author of the book "The Astrolabe", and I created this PostScript program and we hope you find it as useful as we have. You have all rights to use, redistribute, copy sub-macros, modify the program and do as you please.
Ed Popko


