NavList:
A Community Devoted to the Preservation and Practice of Celestial Navigation and Other Methods of Traditional Wayfinding
Re: Longitude around noon. was: Re: Navigation exercise
From: Bill B
Date: 2008 Jun 18, 00:41 -0400
From: Bill B
Date: 2008 Jun 18, 00:41 -0400
Frank wrote:

> Did you ever take a second-year algebra course where you were asked to graph
> parabolas and ellipses and such? They used to call this 'analytic geometry'
> but I don't think that term is used much anymore.

(Huge snip)

I'll reply to you in three parts.

I take no credit for the concepts below.  They are outlined in:
http://fer3.com/arc/m2.aspx?i=024178&y=200506

Part A is my math history. Of probable interest to no one, (it puts me to
sleep) but you asked. I'll leave that to last.

Part B is my graphic exploration of your outline(s) for factoring
north/south vessel motion and declination into LAN Lat/lon observations on
the move.

Part C is a math-based look (to date) at the problem based on your last
post.

PART B

Solving the problem graphically (folding paper method) was easy (for me)
given your outline(s).

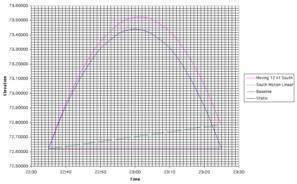
Graph_A.pdf was generated by Excel.  I arranged my longitude with online
data at summer solstice so LAN would occur exactly at 23:00:00 UT and pulled
the elevation for 25 minutes on either side of 23:00:00 June 20, 2008 from a
web site. Staring point N40d 00!0, W164d 33!9, 22:35:00 UT.

Web Site (Omar):
http://www.tecepe.com.br/scripts/AlmanacPagesISAPI.isa

I picked off elevation every 5 minutes before and after LAN, and 4, 3, 2 and
1 minutes before and after LAN. I plotted that data.  Then I plotted the
slope for the south component of the vessel's motion (12 kt).

I asked Excel to add the motion slope to the data already plotted to arrive
at a curve that would simulated the curve observed by a vessel with a 12kt
south vector and no change in declination.  Excel obliged.

Using the folded paper method below, coming within 0d 0!2 of longitude was
easy.  Why wouldn't it be?  After all I was working from an almost perfect
LAN curve.  About the only factors that could throw it off were input error,
eyesight or poor printer registration.

For anyone that requested a "cookbook" method rather than an outline,
following is my prototype recipe based on your and other's suggestions:

1. Start recording observations perhaps 25 minutes before predicted LAN and
continue to 25 minutes after predicted LAN at 5-minute intervals.  More
frequently near predicted LAN.

2. Plot the raw observations. X axis time, and y axis elevation.

3. Calculate the slope of north/south motion and declination changes.

This should be simple for list members.  At 12 kt it would be 0d 12!0 per
hour, and declination changes are listed in the NA by the hour.  If moving
toward the sun, the slope should be positive (subtracted from observed curve
to simulate the fixed-position LAN curve). Away from the sun, negative.
Declination increasing, slope component positive. Declination decreasing,
slope component negative.

4. Now plot the slope on the same sheet of graph paper used for the curve.
(Don't worry about a constant to shift the slope, plot it anywhere that is
convenient.) Plot it for an hour (easy), or if space is limited mentally
halve the x and y components.

5. Move the slope line with parallel rules (or any other plotting device) so
it is anchored at the first observation's x & y coordinates.

6. Using dividers or a drafting compass you can now graphically add or
subtract the slope component at any point along the x axis from the plotted
curve's y axis. Do so by successive approximation around the observed peak
until you construct the "static" LAN curve and have a second peak.

7.  Now you can fold the graph paper along the peak of the y axis of the
constructed LAN curve as per the outline, or pick off the time difference
between peaks with dividers and read the time difference on the x axis.

8. "Apply the Equation of Time to the GMT of Local Apparent Noon that you
found above. You now have the Local Mean Time at LAN, and you already know
the Greenwich Mean Time. The difference between those two times is your
longitude. Convert this to degrees at the rate of 1 degree of longitude for
every four minutes of time difference. Done. We've got our
longitude."--Frank

My only addition" Use the time of peak on the constructed LAN curve.

9. For latitude, use the peak of the moving curve, with the usual
corrections for IC, dip, refraction etc. as suggested.

NOTE:  Want to be a bit closer to EQ of time than posted in the NA at
12-hour intervals?  Calculate the mean value for GHA (15-degree intervals on
the hour) for the nearest UT hour, calculate the difference and divide by
15d.

NOTE:  I have used decimal degrees on my plot's y scale as Excel tolerates
them, but likes radians.  In practice by hand I would use degrees, minutes,
and tenths of minutes on the y scale.


PART C

I *may* see where you are going with the "complete the square" method of
factoring the quadratic equation created by adding the slope to parabola. It
could be a bugger--if not impossible--to factor using the usual tricks, and
the method you proposed *may* have advantages over the other "always works"
quadratic formula. Certainly there are shortcuts I can learn from the math
mavens, but following is where I am now:

Your notation:

> y = a*x + b
> and you add it to the equation for a basic parabola:
> y = k*x^2.
> Now, of course, when you just add them up, you get
> y = b + a*x + k*x^2

NOTE: Usual quadratic a*x^2 + b*x + c = 0


Being visual, I made "k" a negative to flip the parabola and added a
constant "c" to the parabola (as you had already assigned "a" and "b") to
move the peak above y = 0 and reflect he difference in observed elevation
from start to peak. (as you noted, the frame of reference is a potential
problem).

Therefore:  k*x^2 + a*x + b + c = y

Please see attached: Nav_LAN_Square.jpg

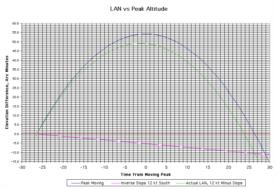
Graph_C.pdf: For this graph I first generated a parabola with "k" based on
an eyeball of the time difference (00:01:20) between the static and moving
peaks plus the 25 minutes to peak in the actual LAN plot of Graph_B.pdf.
(Total x = 00:26:20.) "b" was calculated to anchor the slope at the first
observation.

Then I subtracted the vessel's motion slope. "a" was made negative to
subtract the slope while keeping within your "a*x + b" notation.  "b" was
negative for the obvious reason.

To review:

k = difference in elevation between the first observation and the observed
moving peak / (time from first observation to time of observed peak)^2

c = difference in elevation between the first observation and the observed
moving peak

a = (vessel motion +/- declination change) / time

b = calculated to move x,y coordinates of slope-plot beginning to x,y
coordinates of first observation

NOTE: The static LAN curve calculated from the parabola in Graph_C was over
the initial 50-minutes elapsed time for the perfect LAN curve by 07 seconds,
so my eyeball was a bit off for reading the peak of the moving slope and
calculating k. (Truth be told I found the midpoint of the moving curve in
Graph_B by bisecting x along an axis of equal elevation with a drafting
compass--I had not added the 1-minute-time gridlines at that point so I was
working off 5-minute gridlines.)

Now if I am on track here, I would calculated the positive and negative
values for x when y = 0 (starting point of observations given my equation).

Then I would subtract the absolute value of negative x from the positive
value of x.  Divide by 2 and I have my time offset from observed peak to LAN
which I can use to calculate the time of "static" LAN and proceed as you
suggested to find longitude.

Latitude as above.

That's as far as I have gotten.

NOTE: It works on paper for me, but I can imagine any number of
variables/scenarios that could make either the graphic or math methods
challenging in practice.

PART A

> Did you ever take a second-year algebra course where you were asked to graph
> parabolas and ellipses and such? They used to call this 'analytic geometry'
> but I don't think that term is used much anymore.

Yes, if memory serves. Short story long:

My father was upwardly mobile with UniRoyal (US Rubber). That entailed
moving to a new state about every two years.  Arrive, rent a house, build a
custom home, move.

I spent 6th grade in one school in East Greenwich, RI. 7th grade in yet
another school in East Greenwich, RI. Half of 8th grade was spent in PS 5 in
Patterson, NJ, the other half in Montville, NJ. Freshman year of high school
was spent in Boonton, NJ. Sophomore though senior years in a semi-rural
school near South Bend, IN.

I do recall algebra in north Jersey was a bugger.  Usually an A student I
fought for a B in the first class.  Indiana was like being on cruise
control--no sweat--with the first year or more being almost a review of New
Jersey.  (High school for me would have been 1962-1966.) Somewhere along the
schools' lesson-plan lines I may have missed chunks of meaningful
information. I do not recall "completing the square" as a method for solving
quadratic equations, or algebraic matrixes (prior to a virtual-world film).
Googling it, it does not look at all familiar.  I also do not recall rads or
grads being used in high school trig, just degrees.

During my Purdue days in engineering, I did well in calculus, as well as the
other freshman watershed classes (chemistry and physics).  The second
semester (1967-Rose Bowl win), out of 400 students that started Calculus
162, 200 received a written notice after the first test recommending they
drop the course. Of the 200 that remained only 100 passed.  Of the hundred
that passed less than 50 received a grade above C. I managed a strong B. I'm
not a math wizard to be sure, but with a good teacher and some effort on my
part....

But that's a long while ago. I switched majors to psychology (consumer
research of interest) so those statistics became the math de jour. Along the
way business administration and marketing were added to the pot. In the
words (lyrics) of the Grateful Dead (a USA jam band), "What a long strange
trip it's been." If I could just take a pill to remember all the math/stats
that have gone mostly unused for four decades!

I did buy the "Idiot" books to relearn my teens, and made some progress, but
sadly they (and 99% of my other belongings) have been in storage since early
November as I have had more pressing matters to attend to. (Learning the ins
and outs of Medicare parts A, B, and D; supplementary insurance, and
service-provider billing idiosyncrasies to name a few.) Plus wrinkles on
care taking--pun fully intended.

Thanks

Bill B.


--~--~---------~--~----~------------~-------~--~----~
Navigation List archive: www.fer3.com/arc
To post, email NavList@fer3.com
To , email NavList-@fer3.com
-~----------~----~----~----~------~----~------~--~---


