NavList:
A Community Devoted to the Preservation and Practice of Celestial Navigation and Other Methods of Traditional Wayfinding
From: Frank Reed
Date: 2012 Nov 29, 13:23 -0800
Michael B, of making your own plotting chart, you wrote:
"It's very easy to do: admittedly that rich professional Bowditch calls this an 'emergency navigation' technique."
Great point. I have been mulling this over for a couple of years on and off. Just recently a couple of posts reminded me of the issue again. I think part of the problem is that there is a big misconception perpetuated by Bowditch, other resources (mostly American?), and also by something as simple as the label at the top of commonly available small area plotting sheets. It's confusion over the meaning of the name "Mercator" in mapping. The standard, and correctly identified, global Mercator projection should have died out years ago, but sadly it has been recently resurrected in most global view maps of the world in online mapping software (zoom out on Google Maps to see gigantic Greenland --that's evidence of a Mercator projection). It used to be universal in nautical charting and it has the unique property of keeping rhumblines as straight lines. Other than that, it has no particular advantage over numerous other projections, and it also has some major disadvantages. MANY people who have studied navigation, at least from American sources like Bowditch, have major misconceptions about the Mercator projection and confuse it with simple local "conformality" in a map. A conformal map preserves angles and shapes. If a city block is square, it looks square on the map. If a structure is circular on the ground, it looks circular and not elliptical on the map. When plotting from a list of coordinates, this is done with simple scaling of longitudes. You take each difference in longitude that you intend to plot and you multiply by the cosine of the latitude (any latitude on the chart since it's assumed to be a chart of a small area). This pushes differences in longitude together as we approach the poles. And that's all there is to it! That's what a local area plotting chart does. It's trivial to construct, and you don't need to know anything about "Mercator" to make it because it is NOT a Mercator projection.
-FER
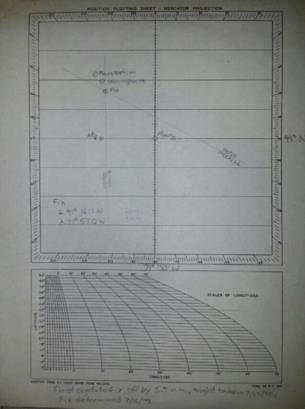
PS: Recently I found my very first plotted celestial fix from July, 1978 (the same summer that an entire issue of the Journal of Navigation was devoted to an amazing new thing called "GPS"). I am attaching it here because the plotting sheet is labeled "MERCATOR" at the top. See above.
----------------------------------------------------------------
NavList message boards and member settings: www.fer3.com/NavList
Members may optionally receive posts by email.
To cancel email delivery, send a message to NoMail[at]fer3.com
----------------------------------------------------------------


