NavList:
A Community Devoted to the Preservation and Practice of Celestial Navigation and Other Methods of Traditional Wayfinding
Re: The Darn Old Cocked Hat - the sequel 1
From: Hanno Ix
Date: 2013 Mar 14, 13:19 -0700
From: Geoffrey Kolbe <geoffreykolbe@compuserve.com>
To: hannoix@att.net
Sent: Wednesday, March 13, 2013 11:46 PM
Subject: [NavList] Re: The Darn Old Cocked Hat - the sequel 1
From: Hanno Ix
Date: 2013 Mar 14, 13:19 -0700
Geoffry:
A little stung by your comparison CelNav to shooting I repeated the
procedure shown in my 'memos' with data from gun shots.
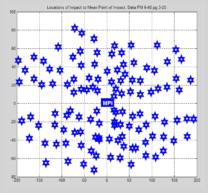
One of the attachment is - supposedly - a copy of the drawing on
pg 3-20 of the doc FM6-60 that Gary posted yesterday.
I have digitized the impacts as good as I could. (1. attachmt)
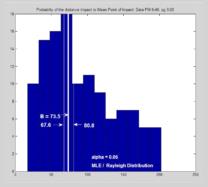
The 2nd attachment shows a histogram of the distances from
Impact to Mean Point of Impact calculated from the impact data.
The data is imperfect since points near the axis' were excluded in FM 6-40
perhaps for graphical reasons. However both, horizontal and vertical coordinates,
have each a distributions as close to a Gaussian as could be expected from this very raw data.
There is a twist: both possess different std variations as compared to the symmetrical
CelNav Case of my memos.
Nevertheless, I think the histogram fits acceptably a Rayleigh Distribution
and compares well with those of CelNav fixes. An MLE yielded a rather
reasonably tight estimation of the parameter B. as shown by the
annotated data.
Therefore I have reason to believe that CelNav and shootings exhibit
rather similar statistcal behavior.
Regards
From: Geoffrey Kolbe <geoffreykolbe@compuserve.com>
To: hannoix@att.net
Sent: Wednesday, March 13, 2013 11:46 PM
Subject: [NavList] Re: The Darn Old Cocked Hat - the sequel 1
At 06:39 14/03/2013, you wrote:
The problem is that Hanno's plots show probability as a function of radius, not probability density as a function of radius. The former is essentially the latter multiplied by the radius, (2*pi*r*dr) which is why there is a hole in the centre of Hanno's graphics. When r = 0, the area is zero and the probability is zero. But this does not mean the probability density is zero.... and that is what John Karl was plotting on his graphics.
Geoffrey Kolbe
I don't see how you get the hole in the center of your graphic. Look at the table of probabilities versus standard deviation.
The problem is that Hanno's plots show probability as a function of radius, not probability density as a function of radius. The former is essentially the latter multiplied by the radius, (2*pi*r*dr) which is why there is a hole in the centre of Hanno's graphics. When r = 0, the area is zero and the probability is zero. But this does not mean the probability density is zero.... and that is what John Karl was plotting on his graphics.
Geoffrey Kolbe
: http://fer3.com/arc/m2.aspx?i=122859


