NavList:
A Community Devoted to the Preservation and Practice of Celestial Navigation and Other Methods of Traditional Wayfinding
Re: Camera distortion of sky images. was Re: NG's "Midnight Fun
From: Marcel Tschudin
Date: 2010 Jun 16, 22:52 +0300
From: Marcel Tschudin
Date: 2010 Jun 16, 22:52 +0300
Regarding George's assumption:

> I presume that before the analysis was made, predicted altitudes of the
> Sun's centre had already been corrected for dip and refraction,.if we're
> looking into such fine distinctions.

After we realised that the measurements depend on the personal
techniques and the personal skill, all the measurements were made then
by Greg alone. In the photos the sun's edges and in this case also of
the apparent horizon were measured. The corresponding angular height
was calculated knowing the position of the observer and the time when
the photo was taken, considering also refraction and dip. I actually
hesitated first to use this procedure for calibration because
refraction and dip introduce additional errors. When Greg made the
photos he had therefore to verify that the horizon was "normal" in
particular that Santa Ana was not blowing. Personally I preferred to
do the calibration only using the sun's diameter as reference and by
integrating over the differential scales. Since the calibration
obtained from the sun-horizon photos showed to be sufficiently good
and the final equations very easy to use we didn't continue further.

The calibration graphs which I previously sent do actually not show
the real amount of distortion. The almost linear relationship is
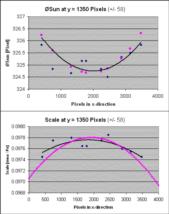
rather a coincidence. I therefore attach here an other figure which
gives a better impression on the amount of lens distortion and how it
was measured for obtaining the differential scale (moa/pixel). This
example is from the 200mm lens. Each data point corresponds to the
mean value of 6 diameter measurements which results from differences
of 6 measurements of the pixel position of the right limb and 6
measurements of the left limb position. The data at y≈1350 Pixels
corresponded to the centre line. The black lines are polynomial fits
to the data in the corresponding figure. The red data refer to the
results from the fit to all data in the x/y-plane which here in the
centre agreed better than at the outer borders.

Marcel


